
Performance analysis is an art. The more you analyze, the more you understand your application and the more insights you’ll be able to gain. In the previous article, we saw how to install and run JMeter. In this article, we are going to dive in the core of the benchmarking science and see how to analyze the performance test results and find the application bottlenecks and their solution.
How To Open the Test Result
STEP 1: Go to the test result folder.
STEP 2: Open the index.html file.
After opening the index.html file, you will be able to see the test results in a browser. Let’s get into the analysis part.
JMeter Test Results Analysis
First things first, Whenever you start analyzing the test results, you have to check the performance statistics.
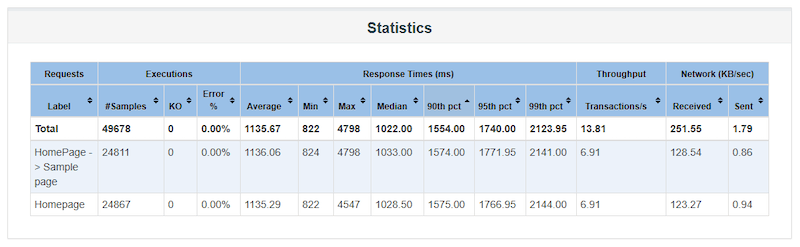
The statistics are the place where you will see the overall performance metrics of your test. Before getting into deep, let us explain about the statistics terminologies a bit.
Label: The HTTP request names.
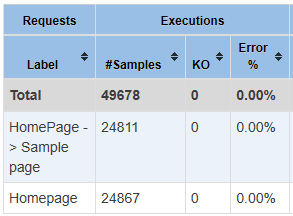
Samples: Number of a successful request.
KO: number of failed requests.
Response Times: It has average, min, max, median, 90th percentile, 95th percentile, 99th percentile.
- Average – The average response time is the sum of all response times divided by the number of responses.
- Min – Lowest response time throughout the test.
- Max – Highest response time throughout the test.
- Median – The median response time (the one that is halfway through the list) is 1022.00 ms. There were 49678 responses, so response #24839 is the median.
- 90th percentile – It indicates that 90% of the samples(requests) took no more than this time.
- 95th percentile – It indicates that 95% of the samples(requests) took no more than this time.
- 99th percentile – It indicates that 99% of the samples(requests) took no more than this time.
Transactions/s: It indicates the numbers of HTTP requests executed per second.
In the below image, We can see the two HTTP requests.
- HomePage->Sample page
- Homepage
The first request sent 24811 HTTP requests successfully and the second request sent 24867 requests throughout the test.
As you can see, there is no error in this test. The error percentage is 0.00%. That means it’s a good sign. Your application can handle 49678 requests in an hour.
Now we will move into response times. In the below image, you can see average, min, max, median, 90th %,95th %, 99th%. Each metric is there for a reason.
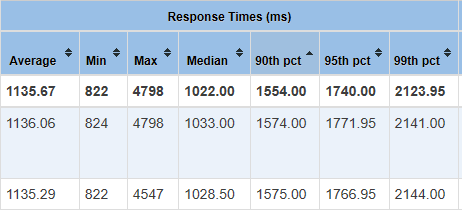
The Average, min, max, median response metrics are self-explanatory and we have already seen the definitions above.
90th percentile – Most of the response SLA entry point criteria been set with the 90th %ile response time (performance testing standards). In the above snapshot, the first request got 1574.00 milliseconds as a 90%ile. That means 90% of the requests throughout the test got a response time of fewer than 1554.00 milliseconds.
95th percentile – If your application’s 90th percentile response time comes under the expected time then you can set your goal to 95th percentile. In the above snapshot, you can see the first request got 1771.95 milliseconds as 95%ile response time. There is no much difference between 90% and 95%. Another good sign that your application can handle 95% of the requests under 1.7 seconds.
99th percentile – Again, If your application’s 95th percentile response time also comes under the expected time. It’s a green signal, that you can increase the load in the next test for benchmarking.
Throughput: The throughput metrics define the number of requests that your application can process. In the below snapshot the overall throughput is 13.81 transactions per second. Requests also called transactions.
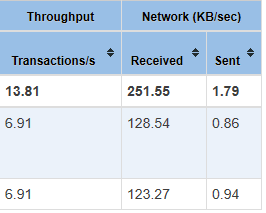
Sent/Received: The average number of KiloBytes/sec sent and received throughout the test for each request.
Ok, I am done with the test statistics, whats next?
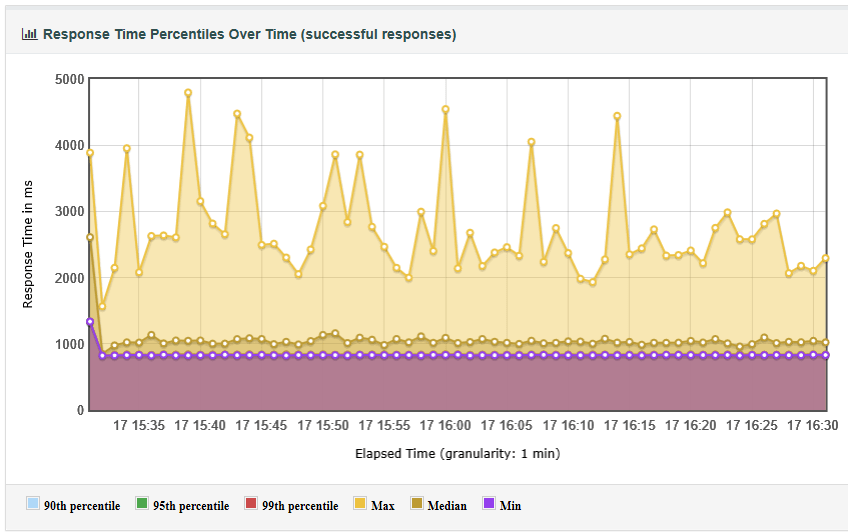
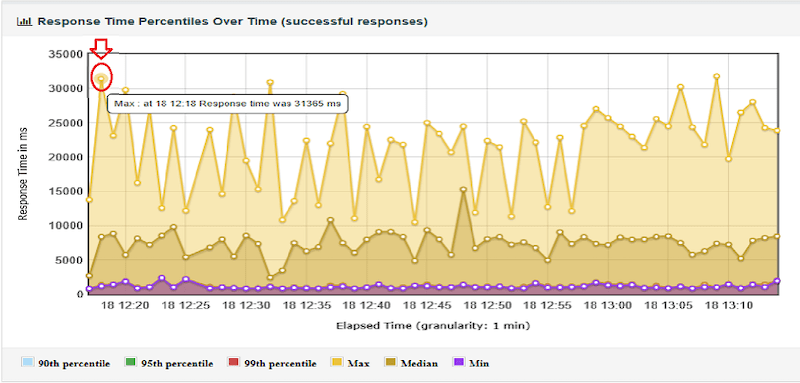
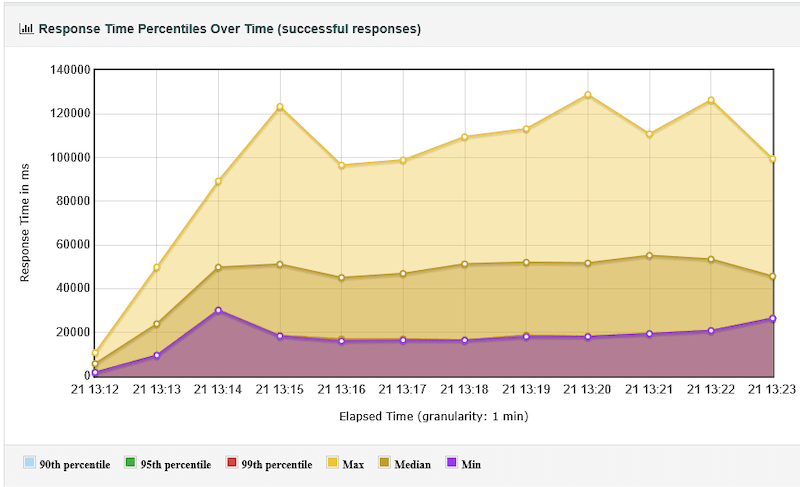
Your response metrics look good, And we don’t think there is an issue with the application but anyway we will check some graphs to see when the highest response time occurred. (i.e 4798 milliseconds – refer to the above statistics snapshot). If you look into response time percentiles over time graph you will be able to see when the high response times occurred. In the below graph, you can see the response time spikes, and when the requests took more than 4000 milliseconds.
The statistics report drives the analysis. If your results look good in the statistics report, then you don’t need to drill down more into the analysis. But when your statistic metrics are having high response times and errors then you need to have a deep look into the graphs and error messages. Keep in mind “More errors, Analyze More”.
Now, let’s get into some problematic test results. In the below statistics report, we have got overall 91.42% failed responses.
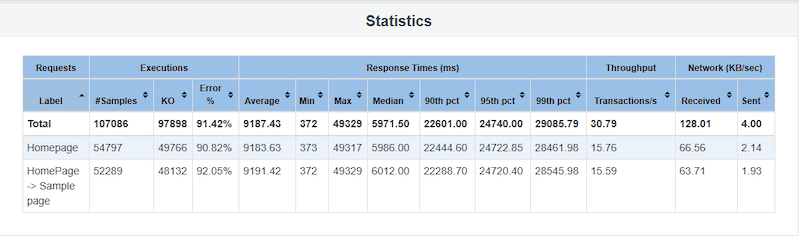
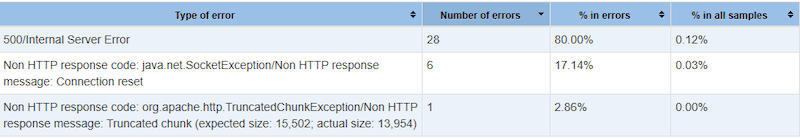
By seeing statistics you can say that some problems occurred during the test. Let’s analyze further. Goto error messages and see the type of errors we have got.
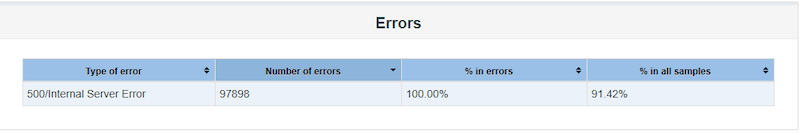
In the above snapshot, We can see that 500 – Internal server error occurred. If you look into the “response time percentiles over time” graph, you will notice that the first high response time spike occurred at 18:12:18 with 31365 milliseconds. Now check the “active threads over time” graph and then compare both the graphs.
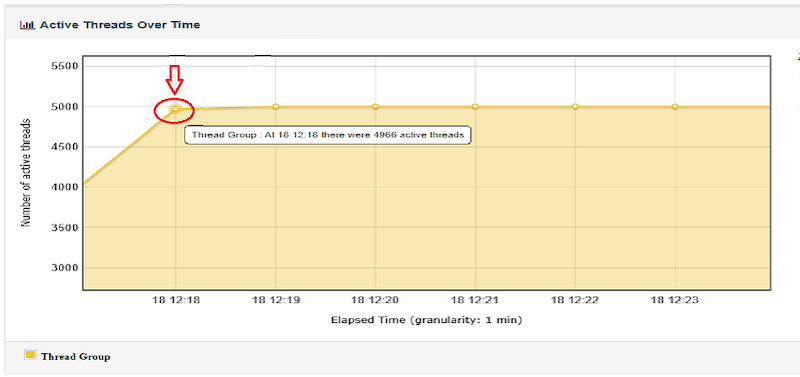
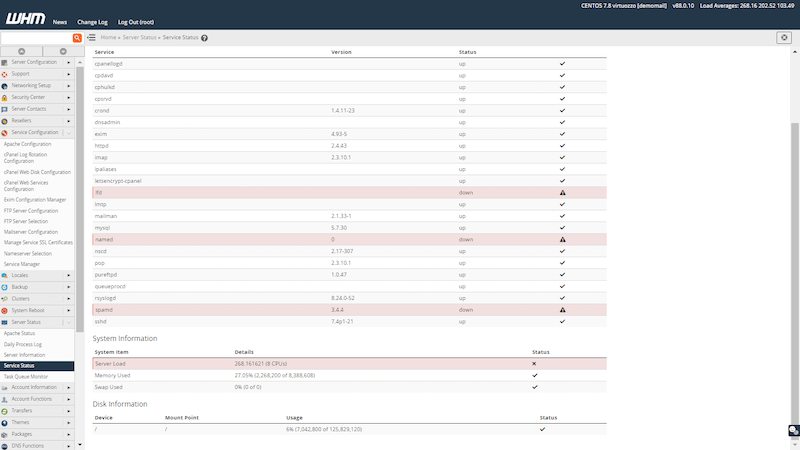
Can you see in both graphs at 18:12:18 spike occurred? At that time there were 4966 concurrent users sending requests to the application. After reaching 4966 users, the application went down (internal server error). If you check the application server logs for the same time (18:12:18) you will be able to see that the application server got rebooted due to heavy CPU load. In the below snapshot, you can see 3 services went down due to heavy server load.
Network Latency
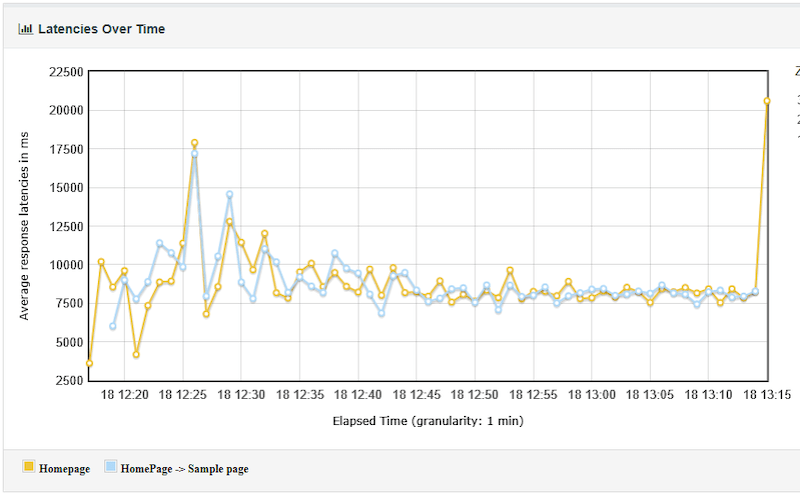
Network latency is a delay involved for your request to reach the server and the response from the server to reach you. In the below graph, Most of the latency of the requests is more than 7500 milliseconds(7.5 secs). This network latency will result in poor response time metrics.
To avoid maximum latencies, Follow the below suggestions.
- Do not use a firewall in a production application.
- Your network hardware will slow down a bit if it hasn’t been restarted in a while. So reboot your hardware frequently.
- Increase your server internet bandwidth speed.
- Upgrade the network hardware once in a while.
- Use an Ethernet network instead of a wireless network.
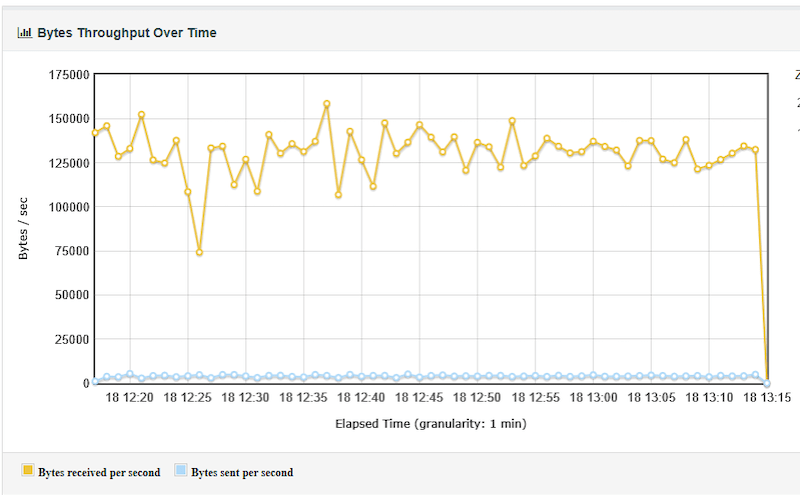
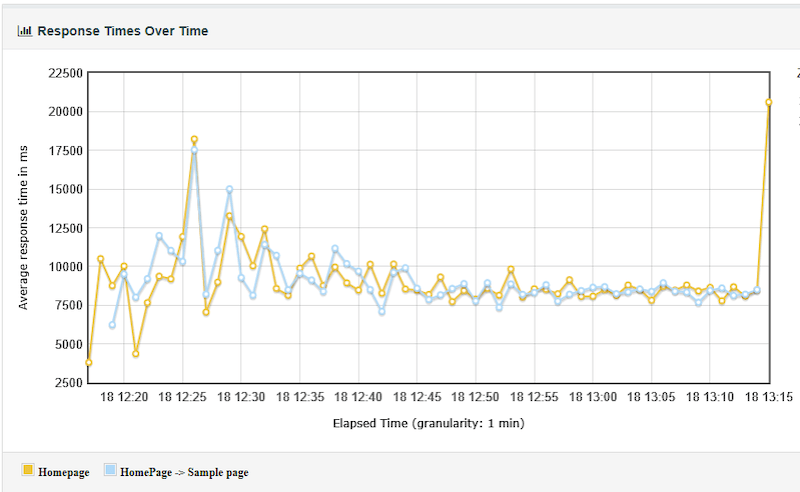
Throughput VS Response Time Comparison
Throughput is the number of bytes received from the server over time. If the response time is low then the throughput will be high and if the response time is high then the throughput will be less. If you compare the response time graph and throughput graph below, you will be able to identify the difference between the two graphs. If you get high throughput metrics that means your application is performing well.
Problems Occurred in an Application During he test and its Solution
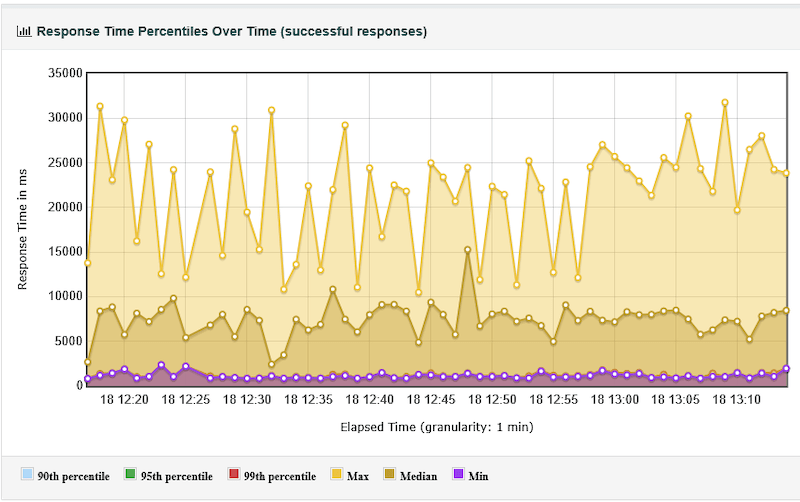
Problem 1: High Response Time throughout the test. Refer to the below snapshot, most of the requests took more than 10000 milliseconds.
When it Occurs:
- If there is any code change in the application.
- If it is a new application then the server cannot handle the load due to server misconfigurations.
- High network latency.
- Heavy load into the server.
Solutions:
- Change server configuration based on the application type (lightweight/Heavyweight).
- Increase the number of server child instances to handle the load.
- Disable the firewalls.
- Use valid SSL certificates.
- Use high network bandwidth.
- Reboot the server once in a while.
- Enable the keep-alive settings and reduce the session limits.
- Increase active SQL connections in server settings.
- Make sure you are not overloading the server in your load test scenario.
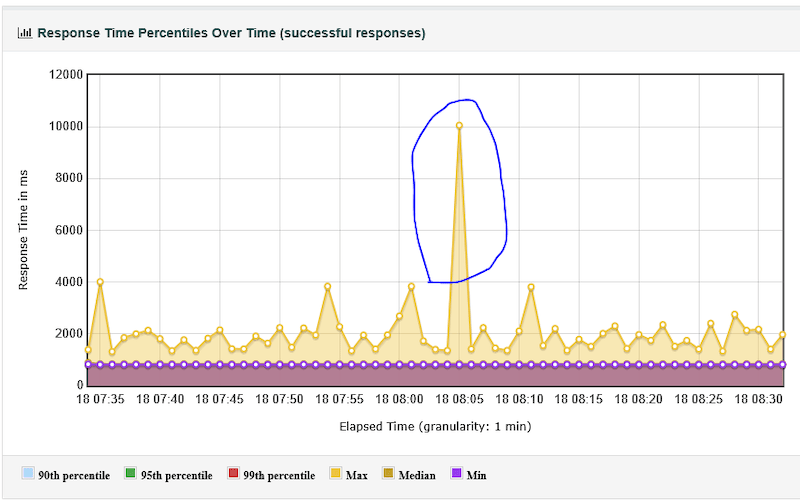
Problem 2: Sudden Spike in Response Time. Refer to the below snapshot.
When it Occurs:
- The application server might be restarted.
- Any batch jobs are running on the server during that time.
- DB Server instances might be restarted.
- Specific SQL Query Processing was high during the test run.
- Network connectivity lost on the server-side.
Solutions:
- Reboot the server two days once.
- Optimize the SQL queries which takes more time.
- Avoid running updates/batch jobs on the server during high usage.
Problem 3: Response time spikes observed after a few minutes of the test run.
When it Occurs:
- App server memory utilization is high after some time.
- More concurrent users at a specific time.
Solutions:
- Increase server memory capacity.
- Autoscale the start server child instances in the server configuration.
Problem 4: Hits Per Second is high and throughput is less.
When it Occurs:
- File reading, downloading, uploading operations might have taken place.
- Request time out settings is not configured in the server.
Solutions:
- Minimize the time out seconds, so that it won’t wait for a longer time to process the request. instead, it will wait for the specified time and fail the request.
- For storing and reading file operations, use a separate server.
- Increase the network bandwidth for the file handling applications.
What happens when the whole server is restarted/down during the test?
If you see any of the below errors. That means your server got rebooted during the test. Refer below snapshot. The server rebooted manually to produce this error.
- 500/Internal Server Error
- Non HTTP response code: java.net.SocketException/Non HTTP response message: Connection reset.
- Non HTTP response code: org.apache.http.TruncatedChunkException/Non HTTP response message.
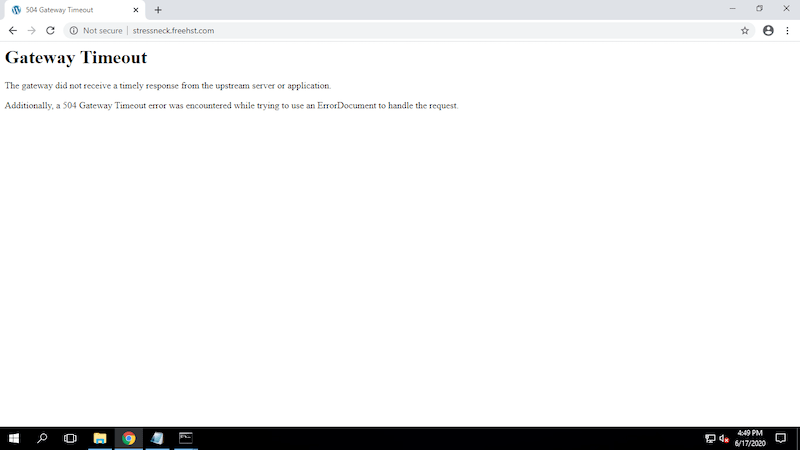
What happens when the Apache server is restarted during the test?
If you see below error, that means your server CPU load is full and it is not able to process the request in a specified time out duration.
What happens, when the DB server is restarted during the test?
You will see the below error in the web browser and in error messages “Error establishing a database connection”, That means the server CPU and memory utilization is high. And it causes the SQL server to restart. There is one more reason that could cause this issue. The number of active SQL connection settings in server configuration settings. Make sure you have configured those settings.
Common JMeter Tool Pitfalls:
Error 1:
Error:jmeter.threads.JMeterThread: Test failed! java.lang.OutOfMemoryError: Java heap space
Solution:
Need to increase heap memory. Navigate to jmeter bin folder. Open the file named as jmeter in notepad. “${HEAP:=”-Xms1g -Xmx1g -XX:MaxMetaspaceSize=256m”}”. Change the Highlighted heap memory value.
Error 2:
Error : Connection refused to host : : java.net.ConnectionException : Connection Refused
Solution:
This problem mostly occurs due to the wrong connection hostname, port number, and proxy settings.
Error 3:
Error: java.net.SocketException: Connection reset
Solution:
Change “Implementation” of all your HTTP Request samplers to HttpClient4. The easiest way of doing it is by using the HTTP Request Defaults configuration element.
Error 4:
Error : java.lang.String”>java.net.BindException: Address already in use: connect in jmeter
Solution:
Change the Jmeter port number in ../bin/jmeter.properties file. Run your JMeter client on a separate machine than the tomcat.
Error 5:
Error: Non-HTTP response message: The target server failed to respond
Solution:
Disable Keep Alive option in HTTP sampler.
Also try edit the jmeter.properties file for retries = 3 and timeout = 120.
Error 6:
Error: ‘error: jmeterjava.io.ioexception exceeded the maximum number of redirects XXX’
Solution:
Add the cache manager and cookie manager in your script. Right Click on HTTP request -> Add -> Config Element -> HTTp cookie manager/ HTTP cache manager.
Conclusion
The above are the most occurred problems during the performance test. Most of the problems would occur due to server misconfigurations or overload. If your website normally takes more time to load the webpage when there is no load into the server, then you need to optimize the code. If your site takes more time when there is a load into the server, then you can proceed with the performance testing to find the bottlenecks.


