
Do you want to test the capacity of your application? Are you curious to know what your application will do when there is a heavy user load? Then case study is made for you.
Why Performance Testing is Great For Your Website?
- Application performance plays a vital role to get more users and good SEO results.
- To know how your application behaves when there is a heavy user load.
- See the application response metrics from the end-user perspective.
- Easily fix the performance bottlenecks of the application.
- Certify the stability of your application.
Ahh… It’s OK, we can understand, it’s boring Nah!!! Let’s get into a real-time example.
What May Happen If You Don’t Test Your Website?
Two friends are searching for a hello world program in java. Both of them searching for the sample code on google. In the search results, they are getting two sites. One is your website and another one is some other website. When these two guys open the link, the other website loads faster, and your website is still struggling to load the Web page. What happens next? He will move to the other website which is loading faster. Congrats you have lost one of your precious users. Nobody wants to lose their customers, right? This is why performance testing is more important for your application.

My code worked fine in the Dev environment but why I am seeing this bug in production?
I bet most of the Developers and Application owners came across this phase. When you test your application in the Dev/QA environment, you test with a single user perspective. Your application will not have any user load and It works fine as expected but the same code when it goes to production you will start to see more errors. WHY? You have no idea why the errors are coming in. Again, you start to test the same production code in the Dev or QA environment, and it works fine. Correct? This cycle continues but you will not able to find out the root cause for the issue. Most of us came across this phase. To fix these production issues you need to simulate the same production load in Dev or QA environment. To do that you need performance testing.
How to do performance testing?
To perform the performance testing we need any automated tool that generates the user load. Here we are going to use “Apache JMeter”. It is an open-source and Industry-standard performance testing tool. This tool has no limitations on the usage of virtual users. You can use how many virtual users you want but all you need is a high performing computer to generate the user load and this is one of the reasons why you need VPS. In this article, we are going to see how to do the performance testing on the VPS (Virtual Private Server).
Why a Server instead of a personal computer/laptop?
Most of you will have this thought, why should I use a Windows VPS / Windows Dedicated Server instead of my computer. Consider you are going to use your personal/office computer to do the performance testing. Everyone knows that such computers are already been installed with loads of applications and each application is consuming a lot of heap memory.
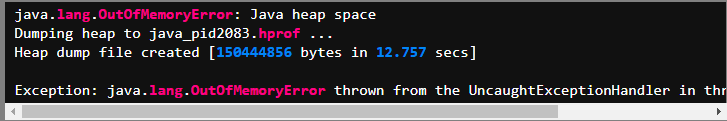
When you try to run the test with 50 users, your computer performs well. That’s good, isn’t it? Now I am going to increase the users count to 500. What’s going to happen? My computer performance will be the same as before? It’s a BIG NO. The resource usage is not the same for 50 users and 500 users. When the users count start to increases, your system resource utilization also will increase. Keep in mind “More users, more resource”. As soon as your computer reaches its heap memory limit level. The JMeter application and your system will stop to respond, and it terminates the test. You will see below the error in the JMeter console. [NOTE: The Heap memory usage and allocation differ for each computer based on its configuration.]
It’s not only about the system configuration. You need high-speed internet connectivity to generate a seamless user load. Your Wi-Fi network speed seems good to you as a single user but when it comes to 500 or 5000 users, All the users start to access the internet at the same time and your Wi-Fi network will not be able to provide the required network bandwidth or the peering of your connection will also become a bottleneck. However, your test will continue to run but you will not get the correct response time metrics for your application and the performance test metrics are useless or may lead to completely false data. This is why we recommend you to use a Windows Server
Benefits of using Windows Server:
- You will get the highly configured remote desktop machines to do the performance testing.
- Most of the heap memory will be allocated to the JMeter application. So, you will not see any out of memory issues.
- Each VPS server can generate up to 15000 users.
- VPS provides unlimited internet network bandwidth. So, you need not worry about internet connectivity.
- The performance metrics will be accurate.
- You can add more than one VPS as a master-slave node in JMeter to generate more user load.
- The VPS can be accessed anytime anywhere.
Next, we will see how to do performance testing in VPS using JMeter.
JMeter Installation and setup in VPS
SOFTWARE PREREQUISITES: Java JDK setup and JMeter binary files.
You can download the required software from the below links.
Java JDK – https://www.oracle.com/in/java/technologies/javase/javase-jdk8-downloads.html
JMeter – http://jmeter.apache.org/download_jmeter.cgi (download under binaries – .zip file)
JAVA INSTALLATION: Just double click on the downloaded .exe file and install it. After the installation, you will have to set the system environment variable path for java. To set a java path, Open the command prompt and type the below command.
SET PATH= <your JDK installation bin directory>
Example:
SET PATH=C:\Program Files\Java\jdk1.8.0_251\bin
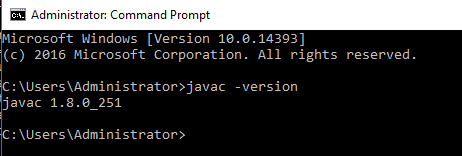
After the path setup, you may verify the Java version by typing “javac -version” in the command prompt you will be able to see the installation version. If it doesn’t work, Add it in the system environment variable manually.
Select Start -> Computer -> System Properties -> Advanced system settings -> Environment Variables -> System variables -> PATH
JMETER SETUP: JMeter does not require any installation. Just extract the downloaded zip file. That’s it!
There are two ways you can open the JMeter application.
- Navigating to the file path and double click on jmeter.bat file
- Set the path in a system environment variable and open via command prompt.
OPEN JMETER USING NAVIGATION: Navigate to the bin folder and double click on the jmeter.bat file (Example path: C:\Users\Administrator\Documents\apache-jmeter-5.3\bin).
![]()
After double-clicking on jmeter.bat file. The command prompt will pop out and the JMeter application will be loaded.
OPEN JMETER VIA COMMAND PROMPT: (This is required while executing test in Non-GUI mode)
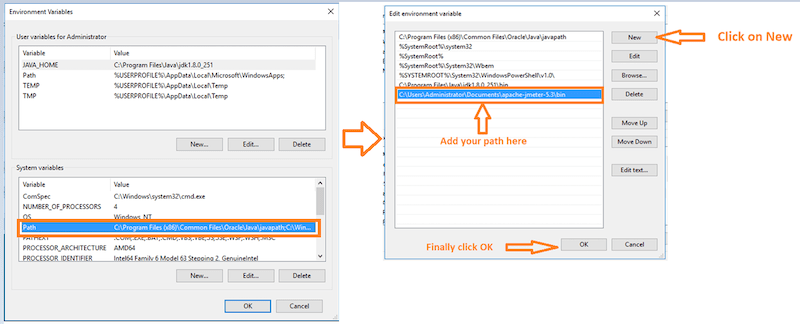
We have to set the system environment variables path for Jmeter first. Go to environment variables and add your JMeter bin folder path in the ‘path’ variable. See below snapshots for your reference.
Navigate to System Environment variables.
Double click on path-> click on New button->add your path->click ok button.
After setting up the environment variable path. Open the command prompt and type “jmeter”. The JMeter application will open.
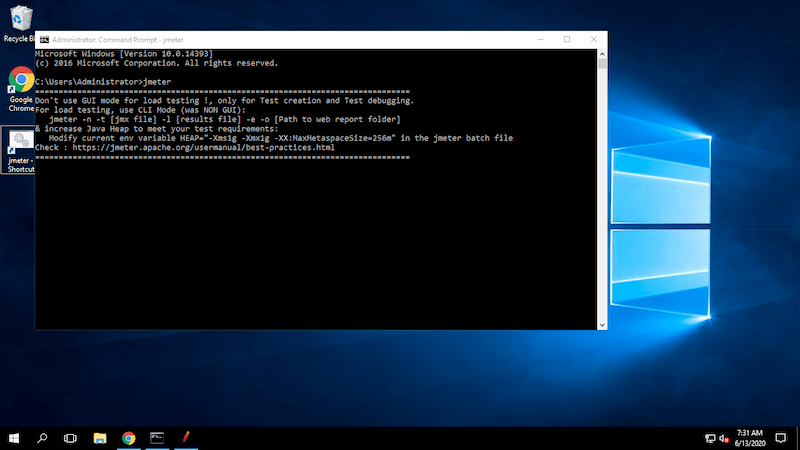
The JMeter Installation setup is done, and almost half of the work is done. You have done a great job!!!
How To create Your First JMeter Performance Test Script:
Follow the below steps to create the performance test script. Refer snapshots for each step for better understanding.
STEP 1: Open the JMeter.
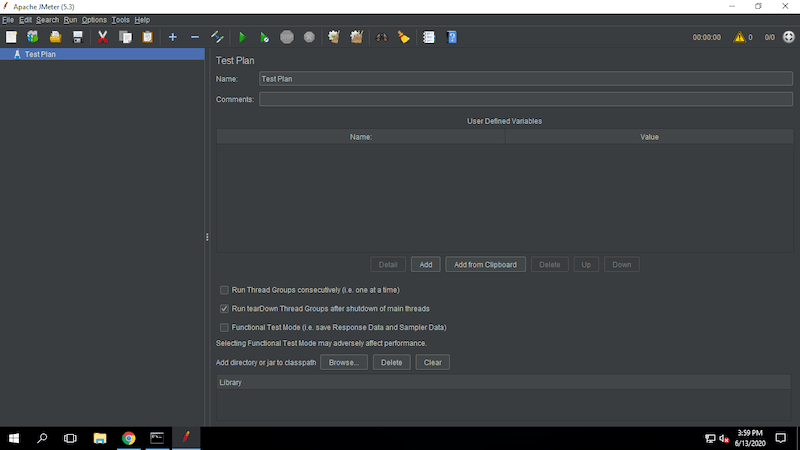
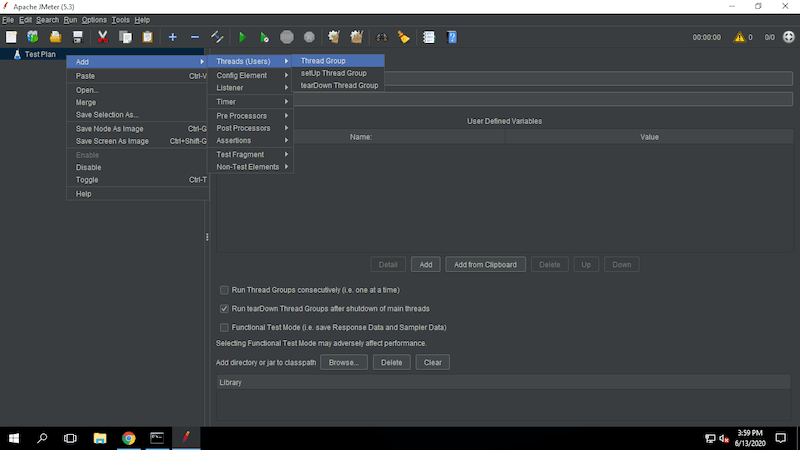
STEP 2: Right-click on Test Plan and then click Add -> Thread (Users)->Thread Group. Click on Thread Group.
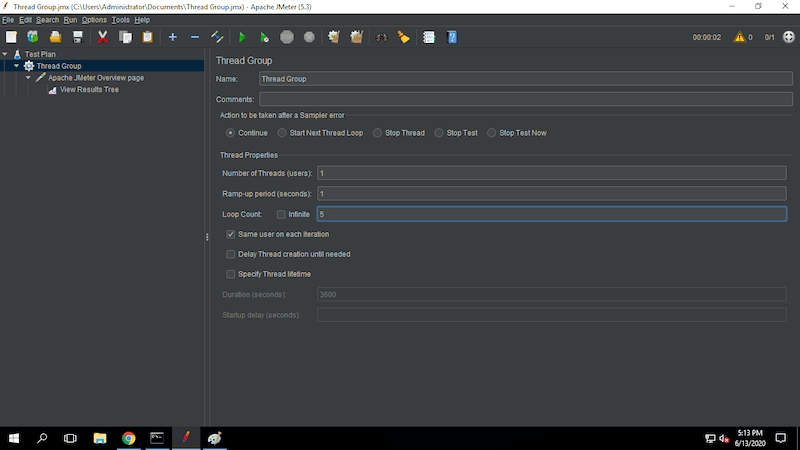
What is Thread Group: Thread group is the place where you define the number of virtual users and how long the test has to run in your test plan. The thread group controls the test script execution. Enter the thread group details as per your need. Refer below snapshot for better understanding.
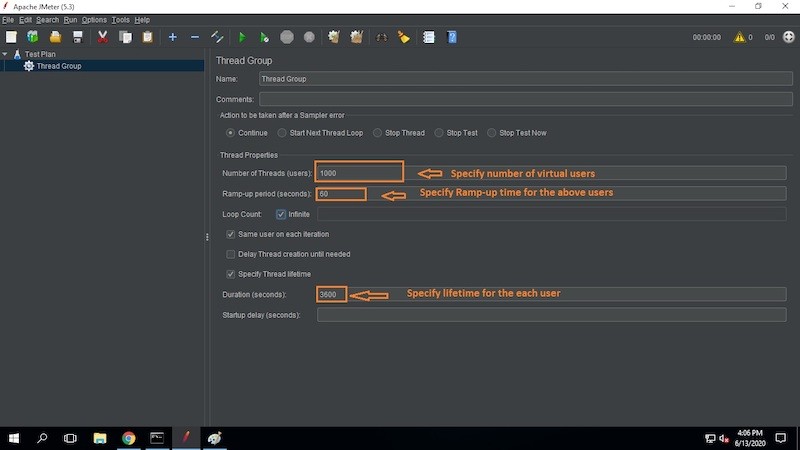
NUMBER OF THREADS (USERS): Add the users count that you want to test your application.
RAMP-UP PERIOD: All the mentioned users will be active at the specified time. In the Below snapshot, all 1000 users will be active in 60 seconds.
LOOP COUNT: Either you can enter the number of loops or choose the infinite option.
- If you specify the loop count, each user will run for the specified number of iterations and moved to stop state.
- If you select the infinite checkbox, each user will run infinite times until the stop action called.
DURATION: Each user will run for the specified time. Here I have mention 3600 seconds (i.e. 1 hour). So All 1000 users will run for one hour and moved to stop status. You can increase or decrease the test timings based on your requirements.
That’s all you need for the users/scenario setup (Basic level).
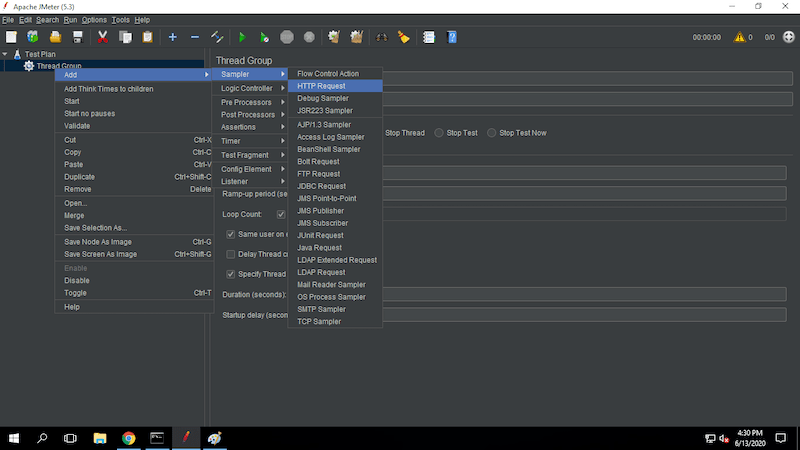
STEP 3: How to create a HTTP requests. Right-click on Thread Group -> Add -> Sampler -> Select HTTP Request.
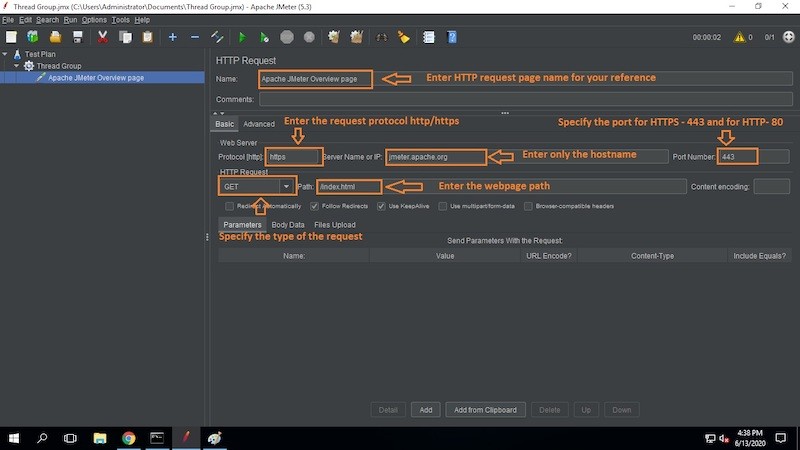
STEP 4: Enter the HTTP Request details.
Here we are going to create an HTTP request for Apache JMeter overview web page. Overview page URL is: https://jmeter.apache.org/index.html
NAME: Name of the HTTP request web page.
PROTOCOL: Mention the request protocol type (it is not mandatory; you can leave it blank)
SERVER NAME: Mention the server name alone. For example, you have the URL: https://jmeter.apache.org/index.html). from this URL, you have to take server name alone (i.e. jmeter.apache.org)
PORT NUMBER: For HTTPS it is 443, and for HTTP it is 80. If your application has any specific port number, then you have to mention that port number here.
HTTP REQUEST: Select the type of HTTP request (GET, POST, etc.).
PATH: Enter the web page path. For example, you have the URL: https://jmeter.apache.org/index.html). from this URL, you have to take the webpage path alone (i.e. /index.html)
Enter the request details as per the below snapshot.
Great job. You have successfully created the HTTP request. You can add any number of requests you want in your scripts. just repeat the same steps 3 and 4.
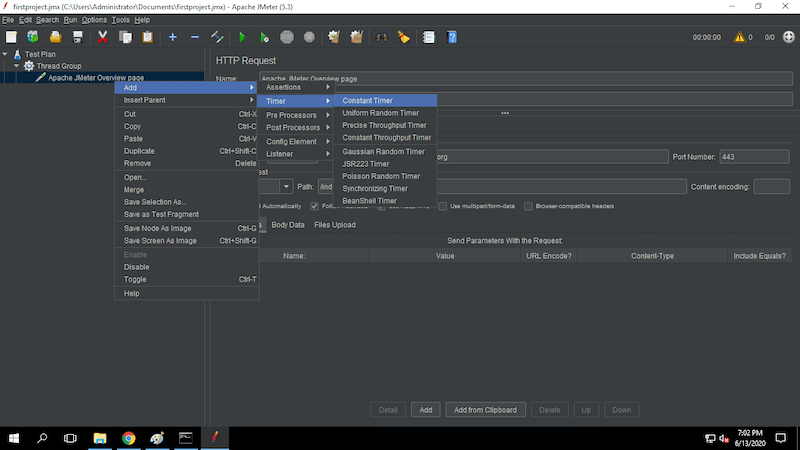
STEP 5: How to add a delay between each request. Why we are adding the delay? When you run the test with no delay, The virtual users continuously send the HTTP request to the server. This can overload your server, and this will not happen in real-world scenarios. To simulate the real-world scenario, we need to add the timer (delay) between each user request.
To Add the Timer, Right-click on the HTTP request -> Add-> Timer -> Constant Timer
You can choose different types of timers based on usage/requirement.
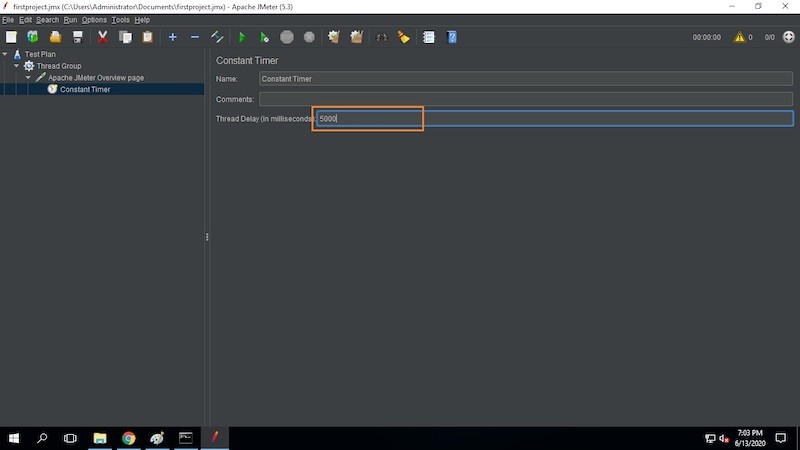
After adding a timer for your HTTP request, Specify the time delay. Here we have kept 5000ms (i.e. 5 seconds)
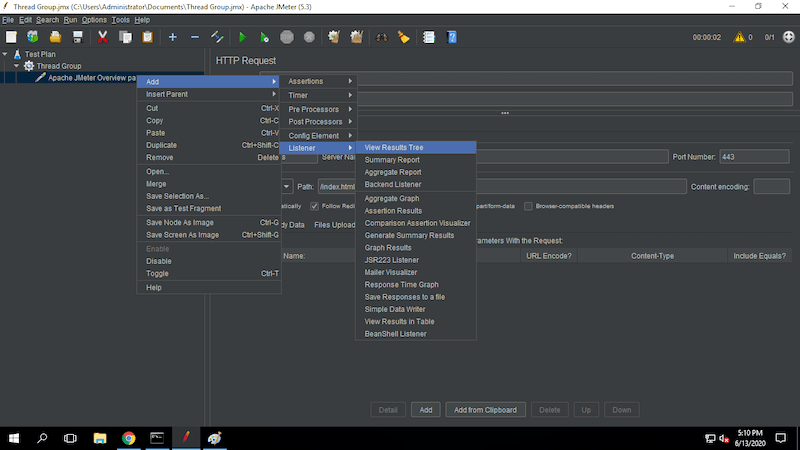
STEP 6: Add listeners to Check the HTTP request’s response. Here we are going to add a “View Results Tree” listener.
Before running validation, click on the thread group and keep similar details as per the below snapshot. For validation one or two users are more than enough. After validation, you can change the number of users and other details as per your requirement.
Here, the number of users is one and it will run 5 iterations (i.e. This one user is going to execute the HTTP request 5 times).
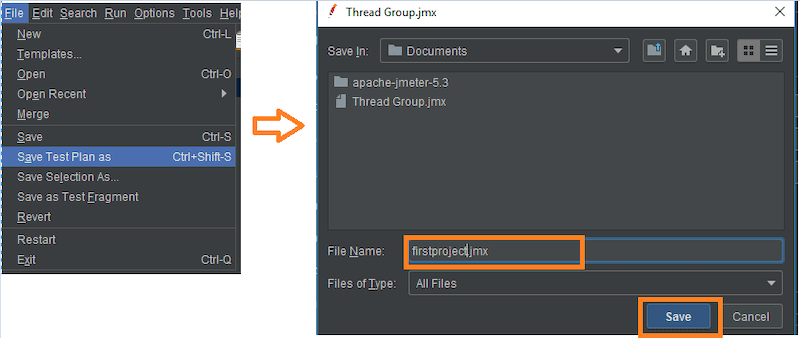
STEP 7: Save the test plan. Click on File -> save test plan as-> Select the folder path -> Enter testplan_name.jmx
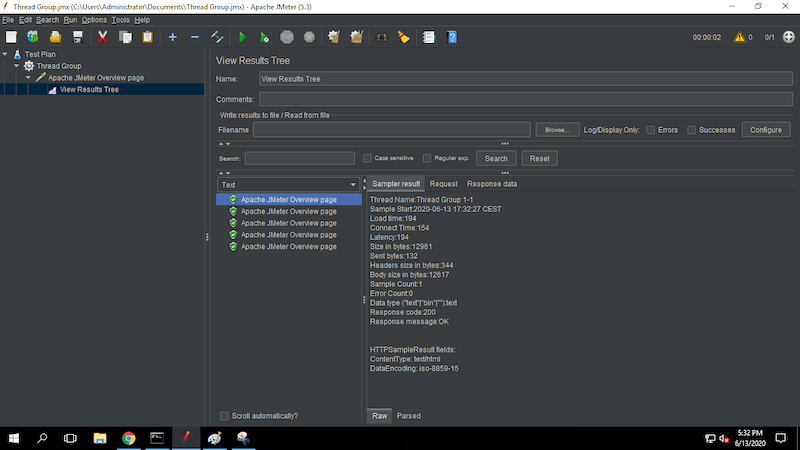
STEP 8: Execute the request for validation. Click on the run button (Green play button) to start the test. Just hover your mouse on the buttons it will show the name of the button. As you can see in the below snapshot. All 5 requests have been executed successfully. You can see the request and response details in view result tree listener. If you see any error, then check your request details and run again.
Script creation is done. Now it’s time for the test execution.
How to Execute your Performance Test Script
Before execution, Remove all the listeners from your script. Why? The listeners consume more memory to store and process the data. This will impact your test execution and system performance. It is recommended to remove the listeners from the script before execution. For GUI mode execution you can keep simple data writer listener or summary report listener. Below you will see when to use GUI mode and when to use Non-GUI mode.
You can execute the test in two ways.
- GUI mode
- Non-GUI mode
GUI mode: Execute the test using the application GUI. The GUI mode is only recommended for smoke tests and short test runs like (below 500 users and up to 10 mins). If your scenario is more than that, It is recommended to use Non-GUI mode. In GUI mode keep only the required listeners (Simple data writer or summary report) and remove the rest of them.
Non-GUI Mode: Execute the test using the command prompt. This method is highly recommended.
How to run the test in GUI mode:
Just click on the run button to start the test. It’s that simple.
How to run the test in Non-GUI mode:
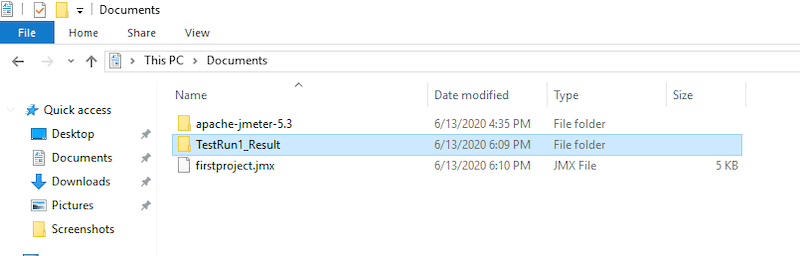
Before executing the Non-GUI Command create one folder to store your test results. Here we have created the “TestRun1_Result” folder. Save and close the project.
Command to execute the test in Non-GUI mode:
jmeter -n -t C:\Users\Administrator\Documents\firstproject.jmx -e -o C:\Users\Administrator\Documents\TestRun1_Result -l C:\Users\Administrator\Documents\TestRun1_Result\logs.jtl
In the above command, we have highlighted the file path. You would need to change the file path accordingly.
1st path: The performance test script location.
2nd path: The test result storage location.
3rd path: The log file storage location.
Make sure there is no space inside the path. Once this folder setup is done, execute the command in command prompt.
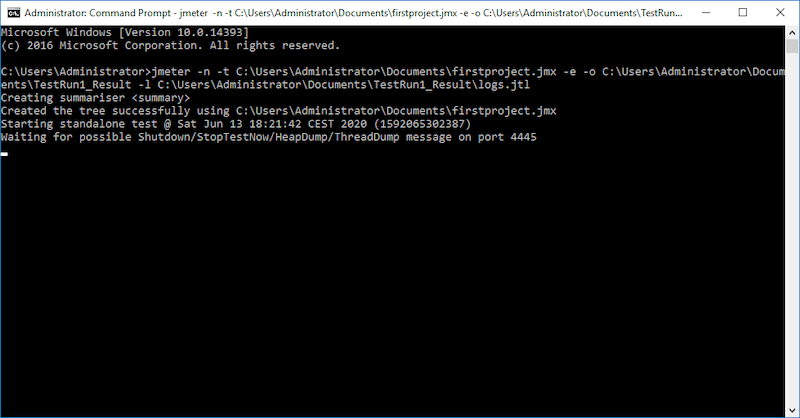
STEP1: Open the command prompt.
STEP 2: Enter the Non-GUI mode above command and press enter. You will see below a similar screen. It means your test has been started.
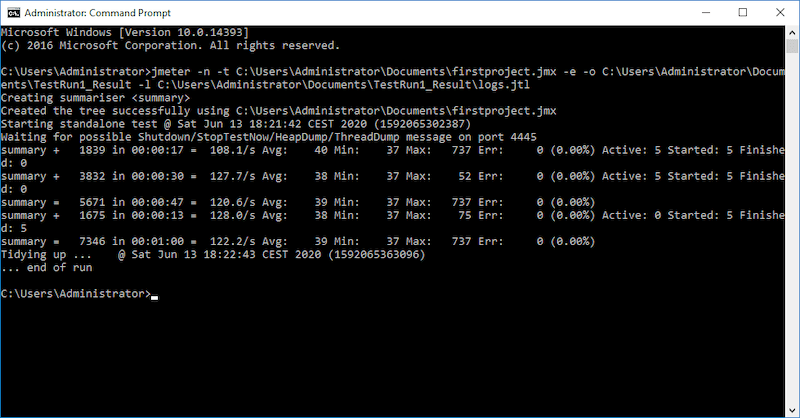
At the end of the test you will see below a similar screen.
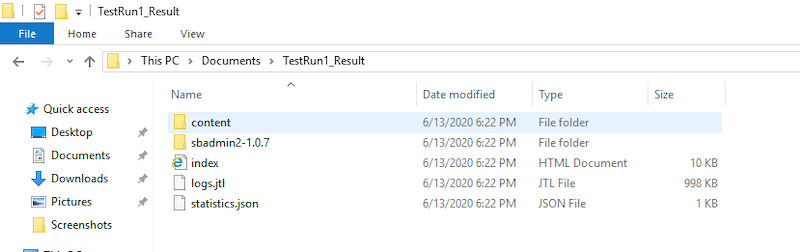
Now go to the results path and check the test results. As you can see the test results have been updated in the results folder.
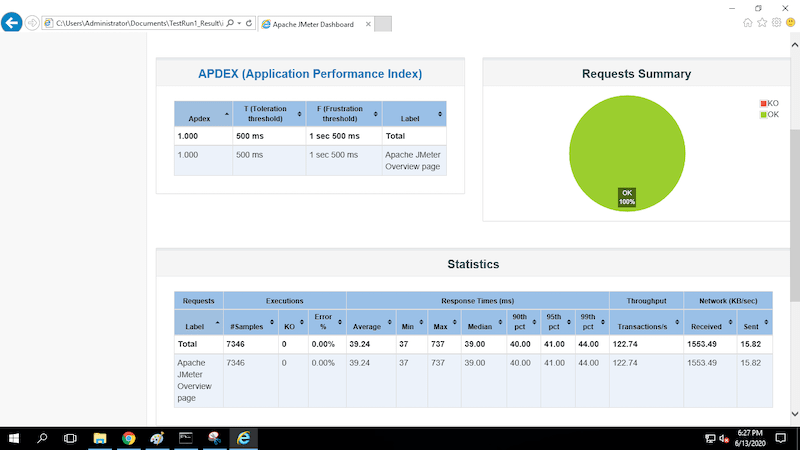
Open the index.html file to view the result. (NOTE: This type of results generated only in Non-GUI mode). For GUI mode you have to prepare it on your own. With these test results, you can analyze your application performance metrics.
That’s it, you have now conducted your first test for your website or application. In the next article, we will cover how to read the tests.


Wow. Great content, easily understandable.